Projects
Benefits of being a popular second choice: Analysis of the 2023 Chicago mayoral election. 2023-04
Analysis of Chicago's dual round mayoral election results on the precinct level provides insight on Brandon Johnson's path to victory in the runoff eleciton.
RStudio R geojson R/ggplot2 ETL (Extract, Transform, Load) Integration data visualization Geographic information systems
Read MoreScraping and analysis of Stop and Shop receipts to study the impact of inflation on food prices. 2023-02
Five years of my friend's online Stop and Shop receipts were scraped using a Python script to collect data on the price of groceries over time to measure the impact of inflation. Plots and analysis using Python, R, and Tableau try to answer the question: how serious is the impact of inflation?
Python R Web Scraping Tableau Data Visualization
Read More
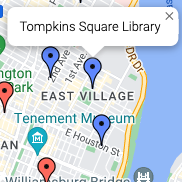
Design of a web application to map NYPL library locations for any book in the online catalog. 2023-01
A Python-based web-scraper is deployed via Flask app to gather information from the NYPL catalog to determine which libraries in the system stock a specified book. HTML/CSS/Javascript is used to render an interactive map to geographically position the found libraries and denote availability status of the particular item at that location.
Python Flask Google Cloud Platform Google Maps API HTML CSS Javascript
Read MoreVoter analysis of NY-3 and NY-4 congressional districts shows reduced Democratic turnout in 2022 elections. 2023-01
Data aggregation of large voter files is performed with Pandas and mapped using GIS in R-programming, while intregrating data from pre- and post- 2022 congressional district boundaries to study voter turnout in 2022 midterm elections.
RStudio R Python shapefile Python/pandas R/rgdal R/sf R/ggplot2 R/dpylr ETL (Extract, Transform, Load) Integration data visualization Geographic information systems
Read MoreThe role of media in 2022 midterm elections 2022
Use of R-programming to integrate recent election results with geographic information data to generate maps to determine the effect of media on the 2022 midterm results.
RStudio R shapefile R/rgdal R/sf R/rjson R/ggplot2 R/cowplot ETL (Extract, Transform, Load) Integration data visualization Geographic information systems
Read More